
The return on an accounts payable automation investment comes mainly from the cost of handling each supplier invoice: the time your team spends receiving, checking, approving, and posting it, and the cost of fixing what goes wrong along the way. To calculate it, you need four numbers: your annual invoice volume, your current cost per invoice, the expected cost per invoice after automation, and the total cost of the solution.
The formula
Calculate the annual savings first, then compare them with what the solution costs:
- Annual savings = invoice volume × (current cost per invoice − cost per invoice after automation)
- First-year ROI = (annual savings − annual running costs − one-time costs) ÷ (annual running costs + one-time costs) × 100
- Payback period = one-time costs ÷ monthly net savings, where monthly net savings = (annual savings − annual running costs) ÷ 12
From the second year, the one-time costs drop out and the ROI is usually considerably higher.
Step 1: Establish your current cost per invoice
Your own baseline matters more than any benchmark. Collect these inputs for a representative period, such as the last 12 months:
- Annual invoice volume, split by how invoices arrive: paper, PDF by email, or structured e-invoice.
- Time per invoice for receipt, data entry, matching against orders, approval, posting, and archiving.
- The fully loaded hourly cost of the people involved, including salary, social charges, and overhead.
- The share of invoices that need manual handling as exceptions, and the time each exception takes to resolve.
- Direct costs such as scanning services, postage, storage, late-payment fees, and early-payment discounts you miss today.
Multiply the total handling time by the hourly cost, add the direct costs, and divide by the invoice volume. That is your current cost per invoice.
Step 2: Estimate the cost after automation
Benchmarks help you check whether your assumptions are reasonable. In Ardent Partners’ State of ePayables 2025, the average cost to process an invoice was $12.42, against $2.65 for the best-performing accounts payable teams. The average processing time was 8.2 days, while organizations using advanced automation brought it down to 2.9 days. Earlier Ardent Partners research from 2024 found that the best-performing teams flagged 9% of their invoices as exceptions, less than half the rate of their peers.
Use these figures as a reference point, not as your result. Base the estimate on what changes in your own process: which steps disappear, which become faster, and how many invoices will still need manual handling.
Step 3: Add up the full investment
Include every cost that the project brings, not only the license:
- Subscription or license fees.
- Implementation and integration with your ERP or accounting system.
- Onboarding of suppliers, for example to get them to send e-invoices.
- Training for the finance team and for approvers in other departments.
- Internal project time from finance and IT.
A worked example
The figures below are illustrative. Replace them with your own.
- 20,000 invoices a year, each taking 12 minutes to handle manually.
- A fully loaded cost of €45 an hour, which gives €9.00 per invoice and €180,000 a year.
- After automation, the average handling time falls to 4 minutes, including the invoices that still need manual attention. That gives €3.00 per invoice and €60,000 a year.
- Annual savings: €120,000.
- Costs: €30,000 a year in subscription fees and €25,000 in one-time implementation costs.
First-year ROI: (€120,000 − €30,000 − €25,000) ÷ (€30,000 + €25,000) × 100 = 118%. Monthly net savings are €7,500, so the one-time costs are paid back in a little over three months. From the second year, the net saving is €90,000 a year.
Benefits that are harder to put a number on
Some of the value does not show up as saved hours. Count it as upside, or assign a conservative value where you have data:
- Fewer errors and duplicate payments, because invoice data is validated before it is posted.
- Shorter cycle times, which make early-payment discounts reachable and keep suppliers paid on time.
- Better visibility of liabilities and upcoming cash outflow.
- A complete audit trail of who approved what, and when.
- Readiness for e-invoicing requirements in the markets where you buy and sell.
How structured e-invoices change the calculation
In manual accounts payable, the largest single cost is usually getting invoice data into the system. A paper invoice has to be scanned and interpreted. A PDF needs capture or manual keying. A structured e-invoice received through the Peppol network arrives as data that can be validated on receipt and passed on to approval and posting without re-entry.
The higher the share of structured e-invoices, the lower your cost per invoice. Include the expected change in that share, year by year, when you calculate ROI. Under the EU’s VAT in the Digital Age (ViDA) package, member states have been able to require domestic e-invoicing without a special authorization from the Council since April 2025, and Belgium, Poland, and France introduced mandatory B2B e-invoicing in 2026. In many markets, the share of structured invoices will rise whether or not you plan for it.
Common mistakes when estimating ROI
- Using a benchmark instead of your own baseline.
- Counting only data-entry time and leaving out exceptions, approvals, and late-payment fees.
- Assuming that all suppliers send e-invoices from day one.
- Leaving internal project time out of the investment.
Where Qvalia fits
Qvalia receives supplier invoices as Peppol e-invoices, EDI, or PDF, and turns PDF invoices into structured data with capture. Invoices can be reviewed and approved on the web and in the mobile app, and posting suggestions speed up account coding before posting.
Want an estimate based on your own invoice volumes? Contact us and we’ll go through the numbers with you.
Related articles
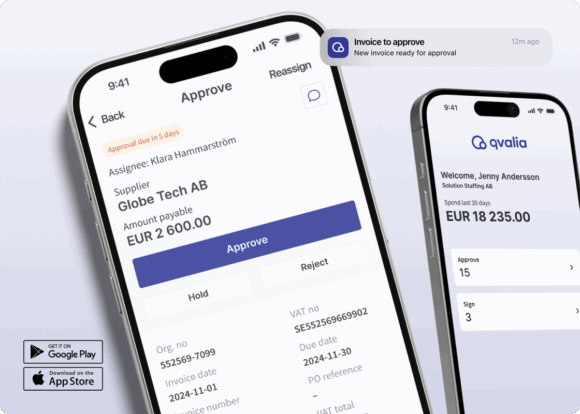
Qvalia is now available on iPhone and Android for invoice approval and AP automation. Review, approve and manage invoice workflows on the go.

Integrated Digital Trade (IDT) refers to the seamless exchange of goods, services, and information between companies through digital platforms and technologies.
Invoice automation, a collective term for technologies that revolutionize how businesses manage their financial processes, is a game changer for finance, accounts payable, and receivable teams.