- What is spend analysis? An introduction
- Spend analytics basics: goals and key metrics
- The spend analysis protocol: a step-by-step guide
- How to access your spend data
- Structuring and classifying your spend data
- Direct vs. indirect spend analysis: what’s the difference?
- Spend analysis tactics: 6 approaches to try
- Common challenges of spend analysis (and how to solve them)
- From cost reduction to value creation: the benefits of spend analysis
- How to get started with spend analysis
- Buyer’s guide: how to choose a spend analysis tool
- Data-driven procurement decisions: your next step
- Qvalia Spend Analytics: real-time spend analysis software
- Usein kysytyt kysymykset

What is spend analysis? An introduction
By Qvalia | Updated September 2026
Spend analysis is the practice of analyzing the purchases and procurement processes of a business to find ways to lower costs and develop relationships with suppliers. It involves collecting and investigating spending data to determine risks and identify new ways to save money.
Research has shown that spend analysis contributes to 5-20% cost savings for each new dollar of spend brought under management. The benefits are therefore direct and significant for almost any type of business.
5-20% cost savings
Source: Aberdeen Group, “Spend Analysis: Working Too Hard for the Money” (2007)
Synonyms
- Procurement analysis
- Procurement insights
- Menojen analytiikka
- Spend visibility
- Spend insights
- Spend monitoring
The procurement data you might consider for analysis comes from a variety of sources, including purchase orders, contracts, organizational financial statements, and enterprise resource planning tools.
When you collect information for spend analysis, you’re gaining important visibility into your corporate spending and help catalyze new short and long-term spending strategies. Because of this data-driven approach, procurement analysis is often empowered by software solutions.

You’re not alone if you think digitization is the best approach to this business process. Data-driven insights into transactions—from procurement to sales—is one of the most promising technology areas for improving operations, resource allocation, and many other business aspects. Even if analysis today rarely is exercised in worksheets, many companies struggle to capture the data efficiently to build and monitor useful key performance indicators (KPIs).
In this guide, you’ll learn exactly what spend analysis is, what your organization can accomplish with it, best practices, and what options you have available to you.
Spend analytics basics: goals and key metrics
What does spend analysis aim to accomplish?
The goal of spend analysis is to answer several questions about the spending practices of the organization. These may include:
- Mitä ostetaan?
- Who are you purchasing it from?
- Who in the company is buying it, and how much money is being spent?
- Are we receiving the quality goods or services we paid for?
- How does our spending compare to that of previous years?
What are the most important spend analysis metrics (KPIs)?
Spend analysts also track certain KPIs, some of which are:
- The amount spent per category of goods
- The number and types of suppliers involved
- Average purchase order value
- Compliance level regarding the established buying policy
- Spending distribution of each department
- Price history of materials and equipment
- Terms and conditions
- Needs of individual departments
This list is merely a baseline of some examples. Every business—depending on size, needs, and industry—has its own unique set of KPIs and goals with regards to spend analysis.
What’s the difference between spend analysis and spend visibility?
While the terms might sound interchangeable, there’s a distinction between analysis and visibility. Spend analysis is a component of an organization’s overall spend management, which itself is made up of visibility, analyses, and processes.
Spend visibility provides a holistic view into how money flows through an organization by understanding the metrics related to these processes. For example, when it comes to audit trails, spend visibility ensures that any information related to an audit trail is readily available and easy to find. Simply put, spend visibility provides a 360-degree view into the flow of money within an organization.
A procurement analysis generates data and results, preferably in real-time, so management can make immediate financial decisions in response to changes in spending. Before spend analysis, most managers merely made decisions after reading past quarterly reports.
The spend analysis protocol: a step-by-step guide
The exact series of steps to undergo changes from business to business, but the following is a basic idea of what happens in a spend analysis initiative; you need to get hold of your purchase data, standardize and categorize it, and present it so you can get insight into volumes, suppliers, and costs.
1. Identify sources
Start by identifying the parts of the business that make purchases: marketing, finance, and procurement teams, for example. Even medium-sized companies might have thousands of these small sources, so classifying them first will make the work much easier.
2. Extract data
Once data is captured, the next step is to consolidate it into a central database, which often involves standardizing the information for easier viewing and comparisons. Data often comes from different sources, so modifying them all to match a similar format may take time.
Tip! Let software do the work.
Qvalia’s platform categorizes line items in real-time for seamless detailed spend insights. Data extraction and quality and accuracy assurance works without effort.
3. Ensure accuracy
Take the time to weed out redundant, erroneous, or obsolete data. Different departments might report the information differently, making it difficult to generate comparable results.
4. Classify
Categorize the data into meaningful groups, such as purchases by supplier or product type to help determine where money is going. Remember, the more detail you have, the better it is for your decision making.
5. Analyze
Finally, use the data to find new opportunities to save and new ways to improve current procurement processes. For instance, you might negotiate a better contract deal or find better suppliers entirely.
How to access your spend data
Spend data accessibility relies heavily on the quality of your accounts payable process. When extracting data from various sources in the organization, keeping the format consistent matters. How do you consolidate data from multiple sources during the extraction process?
The answer lies in automated extraction. There are solutions available that can connect with various data sources, including accounting and enterprise resource planning software within your organization.
The main challenge from here is to unlock access to this spending data accurately and securely in an as detailed way as possible. Your general ledger doesn’t contain row information, so you need to go back to the invoices. Also, do you know enough about your suppliers? Whenever you add new suppliers to your business, how can you integrate them quickly into your overall spending profile and get hold of updated business critical information?
Structuring and classifying your spend data
Classifying data effectively simplifies spend analysis since you can base your decision-making on groups of entries rather than an overload of individual purchases. Many businesses classify purchases based on category or taxonomy. The crucial aspect is how detailed your classification is. With a higher level of detail, with the possibility to drill up and down in your data, the more insightful your analytics will become.
Spend categories vs. spend taxonomies
Spend categories make logical groupings of similar expenditures, which are usually defined at the organizational level. For example, the IT department might handle spending for hardware and software needs.
Spend taxonomies classify spending according to hierarchies much like a tree diagram with branches representing sub-categories of spending. The United Nations Standard Products and Services Code (UNSPSC) system is one example of a taxonomy-based classification approach.

Top categories that your organization might use include:
- Building and maintenance services
- Administrative services
- IT hardware and software
- Engineering and research
- Food and catering
- Healthcare and insurance
- Security and safety
- Vehicles and transportation services
- Televiestintä
Examples of global coding schemes
- UNSPSC
- CPV
- ECLASS
- ETIM
- GS1
- ISIC
- NAICS
How UNSPSC classification works
The United Nations Standard Products and Services Code (UNSPSC) is a taxonomy of products and services in a four-level hierarchy, coded as an eight-digit number, with an optional fifth level adding two more digits.
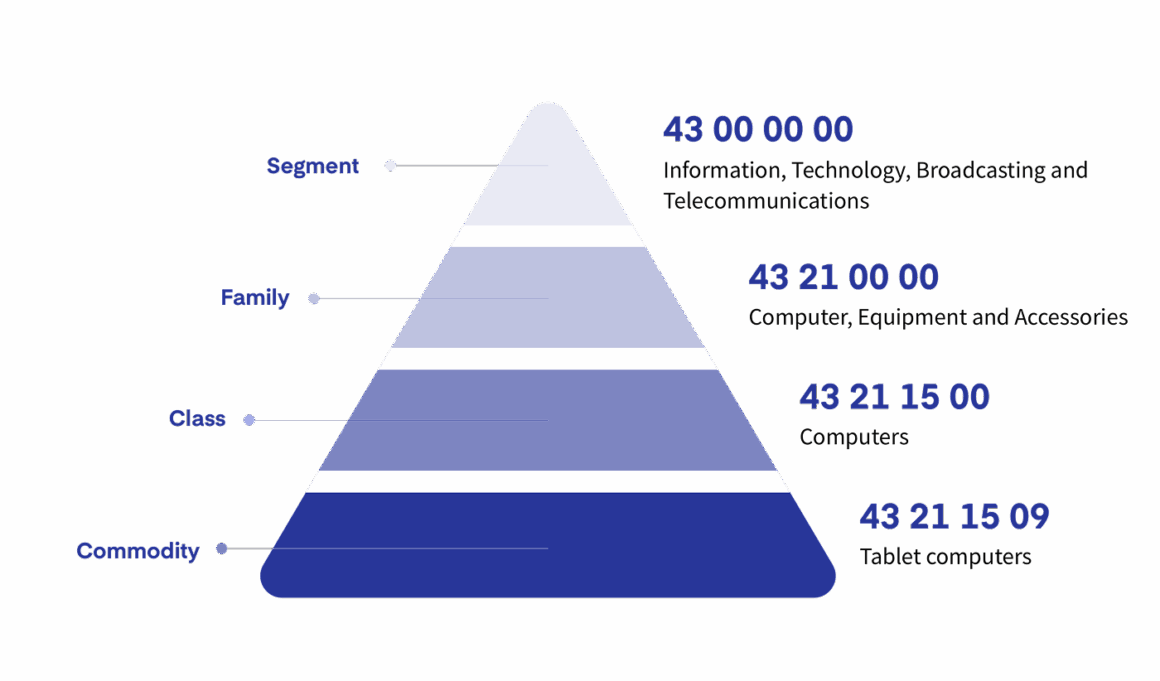
| Level | Code | Example |
|---|---|---|
| Segment | 43 00 00 00 | Information, Technology, Broadcasting and Telecommunications |
| Family | 43 21 00 00 | Computer, Equipment and Accessories |
| Class | 43 21 15 00 | Computers |
| Commodity | 43 21 15 09 | Tablet computers |
158,448 different products and services codes in UNSPSC
The UNSPSC was originally created in 1998 through a joint effort that included the United Nations Development Programme (UNDP) and Dun & Bradstreet. GS1 US managed the codeset from 2003 through the end of 2024; since January 1, 2025, it has been managed directly by the UNDP, which oversees all aspects of coding, updates, and new initiatives. The codeset is currently available in a PDF version at no cost, and comes in a variety of common languages, including English, Spanish, German, French, Mandarin Chinese, Swedish, and many more.
Search for codes here:
unspsc.org/search-code
Top level segments in UNSPSC
- Raaka-aineet
- Teollisuuslaitteet
- Laitteiden osat ja tarvikkeet
- Valmistetut tuotteet
- Palvelut
Automation can accelerate the classification process, but the ideal tool is not a black box. It’s in your best interest to know why certain purchases are going to specific categories, and that there is flexible and easy to use functionality to explore categories and hierarchies of classes.
Spend Analytics visualizes real-time purchase data, with advanced options to drill down into your data.
Direct vs. indirect spend analysis: what’s the difference?
Spend analysis can apply to two different groups of transactional data: direct and indirect spending.
Direct spending refers to the purchases the business uses for the creation of its products and services. These include raw materials, components, hardware, or anything else directly related to manufacturing.
Indirect spending does not relate directly to manufacturing. These costs might do with maintenance or developing internal operations. Examples are marketing services, consultants, travel fees, maintenance and repair, IT, human resources, transportation, and utilities.

Approach to costs
Direct spending analysis projects typically think of transactions by estimating how much they should cost and negotiating accordingly. Teams working with indirect spending projects take a zero-based budget approach, where they reduce costs as much as possible by justifying every expense before adding it to the invoice. Some direct costs are unavoidable, but many indirect costs tend to have the opportunity to justify themselves.
Determination of need
When direct spending management works with the manufacturing process, it needs to prevent delays by ensuring all raw materials are in stock at all times. By contrast, indirect spending only needs to purchase new goods when demand dictates it.
Management spread
The management of direct spend is often centralized through procurement and supply chain teams, while indirect spend is often scattered across the organization. Many independent stakeholders with their own budgets and needs often handle all the small aspects of indirect spend.
Supplier relations
Promoting positive relationships with suppliers is more a job for the direct procurement teams, as suppliers directly impact the quality and price of the raw materials, which in turn reflect in the quality of the final products.
Spend analysis tactics: 6 approaches to try
There’s no one-size-fits-all approach to spend analysis. It’s highly dependent on your specific line of business and industry. The following are a few tactical use cases:
Category-based
Remember those categories of transactions you made? Spend analysts often take the time to understand the scope of these categories. Are you buying too many similar goods that do essentially the same things? Categories can give you insights into what you’re procuring and allow you to prioritize based on needs and budget.
Item-based
Some teams choose to analyze expenditure at the line item or stock-keeping unit (SKU) level. For every purchase, classify it, identify the supplier, and determine the exact end user receiving the item. If you are buying the same item from different suppliers, there may be an opportunity to choose a better price.
Contract-based
Is your organization complying with existing contract terms? A contract-based spend analysis helps identify areas of non-compliance with your contracts and makes sure that only the optimal contracts are being negotiated.
Supplier-based
How much are you spending on certain suppliers? The supplier-based method creates an overview or profile for each supplier using historical transactional data. By searching for buying patterns, you can identify outliers and consolidate relationships with suppliers effectively.
Tail spending-based
Tail spending refers to all the “leftover” spending that your main categories miss. These purchases are the small and infrequent ones that management might not think about adding to the logs. Spend analysis naturally focuses on the majority of your spending; the remaining smaller portion usually doesn’t get much attention.
Payment term-based
Suppliers often offer discounts for paying invoices early. At the same time, paying too early can cut down on your working capital. A payment term-based approach helps you gain that lost interest and negotiate better payment terms.
Common challenges of spend analysis (and how to solve them)
It can be frustrating when efforts fail to generate expected results. There are several reasons why spend analysis occasionally does not deliver on promised returns.
Red tape resistance
Because spend management results in changes in purchasing decisions, some stakeholders may see it as a threat that may reduce the quality of manufacturing output or make internal operations more difficult.
Managers of separate departments can be resistant to change, and some of the new policies may contrast with their current preferences. Ensure that all stakeholders understand the impact of your decisions before going through with spend management.
Classification confusion
Some organizations struggle with cleaning up and putting complex data into useful taxonomies and dimensions. For instance, how do you decide whether to categorize based on project, department, product, or anything else? All approaches have their own pros and cons and appeal to different types of businesses. For most, the answer lies in the mix.
There’s no single panacea for classifying spend data, but given the sheer volumes automated solutions are ideal for the job. Ideally, you want as detailed information as possible to be flexible. Existing solutions often struggle with processing data from multiple sources and tracking information coming from downstream. You need to take control of data from its source for more efficient spend analysis. Qvalia integrates spend analysis seamlessly into the day-to-day handling of business transactions.
Multiple sources of information
Identifying all the areas where expenditures are made isn’t always simple since some sources may be easy to miss. Communication among departments may be lacking, and involving all the department heads in the responsibility of spend analysis is recommended for this reason. This is why it’s important to use data directly from the source—your transactions.
Low-quality data
From discrepancies to inconsistencies to mere human error, not all data collected might be suitable for analysis. And if your business operates internationally, handling the exchange rates among multiple currencies can also introduce errors. Following a consistent data structure, and standardized machine-readable formats, throughout all your departments are the best defenses against this problem.
Using the wrong tools
Spend analysis has for many businesses become an essential business process that dedicated tools are now available to help. There are many analytical solutions in finance and procurement to choose from that can accelerate your ability to extract the right data and generate insightful reports. Traditionally, spend analysis has been applied to data upstreams where invoice data and line items must be recreated to produce detailed reports. Choosing the right spend analysis tool requires focusing on the ability to work with data that’s accurate and as real-time as possible.
Invoices managed in Qvalia are automatically categorized and accessible for analysis in real-time.
From cost reduction to value creation: the benefits of spend analysis
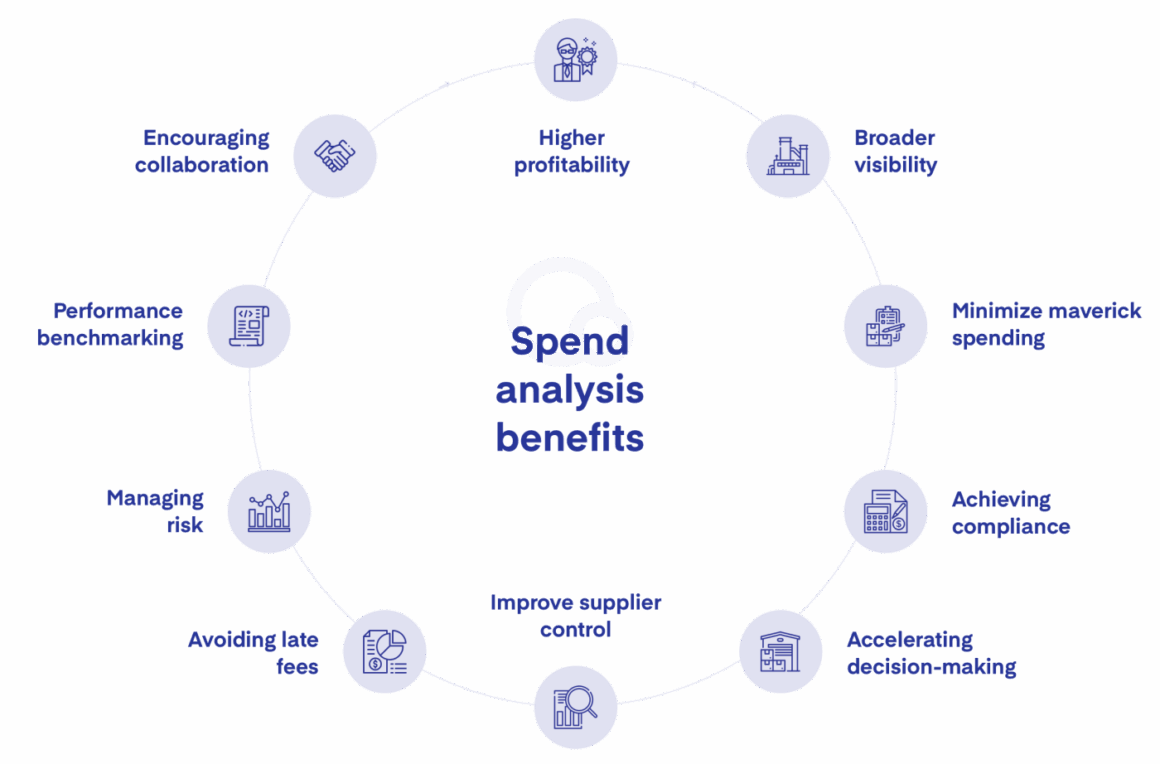
The advantages are numerous for the businesses ready to dive into their purchase data and getting started is fairly easy. Key advantages of spend analysis include:
- Higher profitability
- Broader visibility
- Accelerating decision-making
- Managing risk
- Minimize maverick spending
- Improve the supplier control
- Achieving compliance
- Encouraging collaboration
- Avoiding late fees
- Performance benchmarking
1. Higher profitability
Your teams will find new opportunities to save money by shedding light on expenditures throughout the organization. Procurement teams can eliminate duplicate purchases that fall through the cracks and negotiate bulk orders to get more “bang for your buck.”
2. Broader visibility
What you learn from achieving spend analysis enables you to make more informed business decisions in the future. Whether it’s identifying new ways to save or generating incremental improvements in the budget from quarter to quarter, those savings add up over time.
3. Accelerating decision-making
When it comes to negotiating contracts and designating new suppliers, the progress you make in spend analysis can help reduce the cycle times. Spend data, for example, lays down the ground rules beforehand and gives your teams the metrics they need to make decisions.
4. Managing risk
A company’s projects and final products rely heavily on suppliers. Spend analysis naturally allows you to track the financial performance and credibility of your suppliers. This way, risk becomes apparent sooner rather than later, and procurement teams have a chance to make alternate plans in case risk is detected.
5. Minimize maverick spending
When you see outliers in your spending chart, you have a chance to eliminate unauthorized spending.
6. Improve the supplier control
A better understanding of the price and quality of your sources helps you rationalize your supplier base. Knowing your supplier is important in everything from critical events like bankruptcy to strategic insights into supply chains, and decisions on offshoring and reshoring.
7. Achieving compliance
Tracing old transactions and documenting financial activity goes a long way to achieving regulatory compliance. The granular reports you make enable you to audit your business whenever necessary.
8. Encouraging collaboration
It’s not uncommon for a group of companies to make a bulk, shared order of goods and services. The visibility procurement analysis offers helps organize these joint buys.
9. Avoiding late fees
Prevent penalties from late payments by closely watching where money is going. The result is better supplier relations and the potential to unlock discounts for fast payments.
10. Performance benchmarking
Financial data can tell you which departments generate the most revenue given their spending. Spend analysis enables setting goals that are achievable and realistic.
And these points are just the beginning. Introducing spend analysis capabilities to your teams also lets you track your financial performance against the market, optimize your working capital, identify price arbitrages, and achieve many other benefits.
How to get started with spend analysis
The companies that perform the most efficient spending analyses all share a few common strategies.
Aim for big solutions through small steps
Don’t focus merely on small fixes. While consulting with external services and improving data classification all matter, it’s more important to replace traditional, expensive procedures with a more sustainable, automated solution. The high complexity of spend data calls for a modern approach.
Take action and track progress
Based on the insights generated from the spend analysis program, take advantage of new opportunities and savings immediately. Developing new strategies and sticking to them is just as important as collecting the data initially. Don’t forget to check the impact of your work.
Make it a team effort
Don’t think that procurement analysis is purely the job for financial or procurement professionals. Collaborate with all your stakeholders, from the IT department to other parts of the company, to get the most out of potential savings. Leveraging everyone’s participation allows higher quality, more complete data and stronger steps towards better performance.
Continually improve
Spend analysis should not be an occasional event-driven activity, but rather a constant work in progress. Always look to expand the scope of your efforts.
Buyer’s guide: how to choose a spend analysis tool
This section goes into detail regarding what to do when shopping for procurement technologies. Tools like these offer automation services to streamline spend analysis.
1. Start the process
It’s almost always better to get the process started. After all, even a small improvement is a step in the right direction. Qvalia makes it easy for you to visualize key spend analysis data, allowing you to create your own methods and KPIs to track progress and benchmark your success.
2. Convince your peers of the importance of spend analysis
Getting everybody on board is an essential step. Communicate to upper management what benefits it can expect from the initiative if you need to justify the initial investment.
3. Go shopping
Assess the market and its various options. Many solutions are tilted towards the complex when it comes to setup and usage. Most businesses will benefit from choosing according to its integration capabilities and ease of use.
4. Build a list of potential vendors
Because you will be working with your automated solution for a while, take the time to make the right choice. Select the best match for your business.
Data-driven procurement decisions: your next step
Spend analysis is an essential component of any modern procurement and finance department. This critical strategy offers a lot of insight into the financial processes all businesses rely on.
Forward-thinking companies that want to optimize all aspects of internal finance, from accounts payable to receivable, should see spend analysis as a foundational building block that drives informed decision making. Get started today.
Plus: Our full suite of cloud-based automation manage services your daily financial tasks including detailed capabilities to monitor your spend. It’s modularized and customizable with transaction-based pricing.
Qvalia Spend Analytics: real-time spend analysis software
Effortless insights in real time for your procurement team
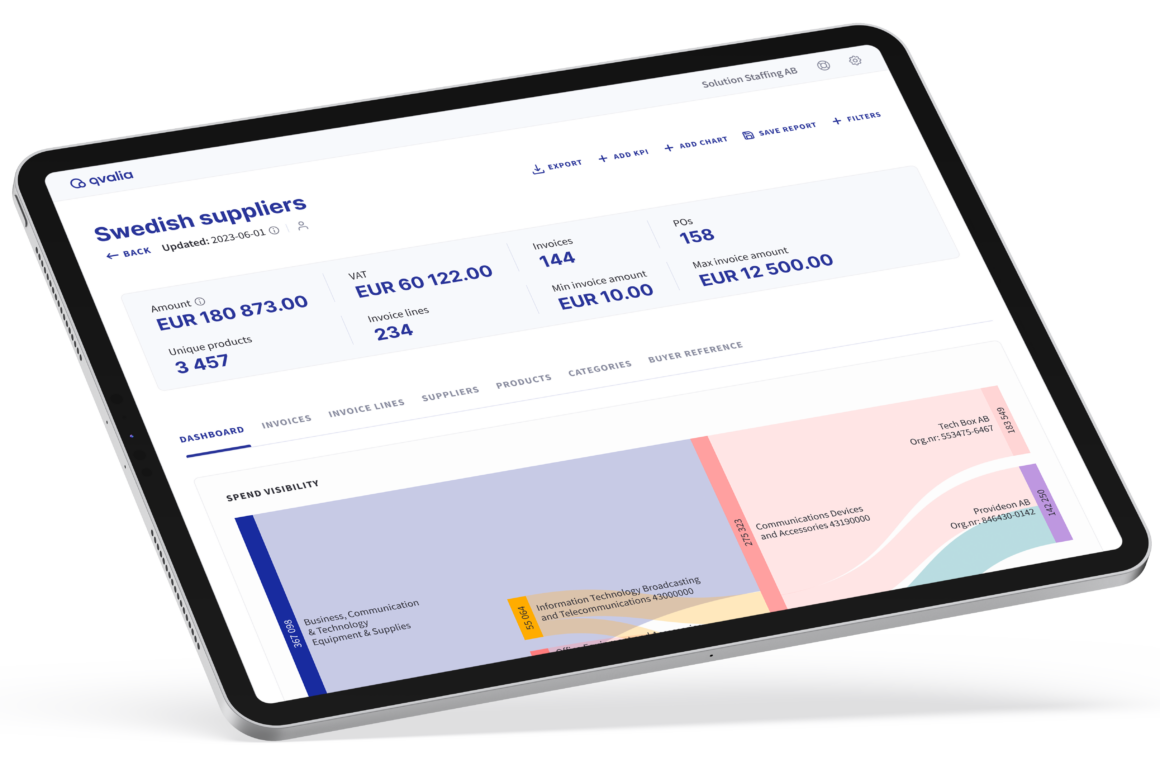
Spend Analytics by Qvalia provides a novel solution that gives you an instant overview of your spending, including total spend, number of suppliers, VAT, average invoice amount, total purchase orders, and line-item level analysis.
Key features of Spend Analytics
- Get your spend data in real time: From suppliers to invoices, you can see it all in real time. There’s an overview of your spending over time and drill down into the categories to explore.
- Sort suppliers: Increased control over suppliers by allowing you to sort suppliers by credit rating, time period, product category, and region. Qvalia also offers a comprehensive overview of all your spending for specific vendors.
- Detailed product categorization: Follow your spending with a global 5-level hierarchy of over 50,000 products and services.
- Keyword search: Find things quickly with built-in keyword search. Qvalia makes it easy for you to locate specific items, line-item information and suppliers.
- Customize your dashboard with filters: Track the KPIs you care about most, measure progress, and turn your data into powerful insights.
Usein kysytyt kysymykset
Mikä on kuluanalyysi?
Spend analysis is the practice of analyzing the purchases and procurement processes of a business to find ways to lower costs and develop relationships with suppliers. It involves collecting and investigating spending data to determine risks and identify new ways to save money.
What’s the difference between spend analysis and spend visibility?
Spend analysis is a component of an organization’s overall spend management. Spend visibility provides the broader, holistic view into how money flows through an organization, while spend analysis is the practice of digging into that data to find savings and manage risk.
Mikä on UNSPSC-luokitus?
UNSPSC (United Nations Standard Products and Services Code) is a taxonomy of products and services organized in a four-level hierarchy — Segment, Family, Class, and Commodity — coded as an eight-digit number, with an optional fifth level for business function.
What’s the difference between direct and indirect spend?
Direct spending covers purchases used directly in creating a business’s products and services, such as raw materials and components. Indirect spending covers everything else that supports internal operations, such as marketing, consulting, travel, IT, and utilities.
How much can a company save with spend analysis?
Industry research from Aberdeen Group found that enterprises can achieve 5-20% cost savings for each new dollar of spend brought under management, with the exact figure depending on how much spend was previously unmanaged.
How do I get started with spend analysis?
Start by identifying every part of the business that makes purchases, extract and standardize that data into a central source, classify it into meaningful categories, and analyze it to find savings opportunities. Automated tools such as Qvalia’s Spend Analytics can handle extraction and categorization in real time so the process doesn’t rely on manual spreadsheet work.
Ota yhteyttä
To learn more about how Qvalia’s Spend Analytics can give your analysis efforts a head start.